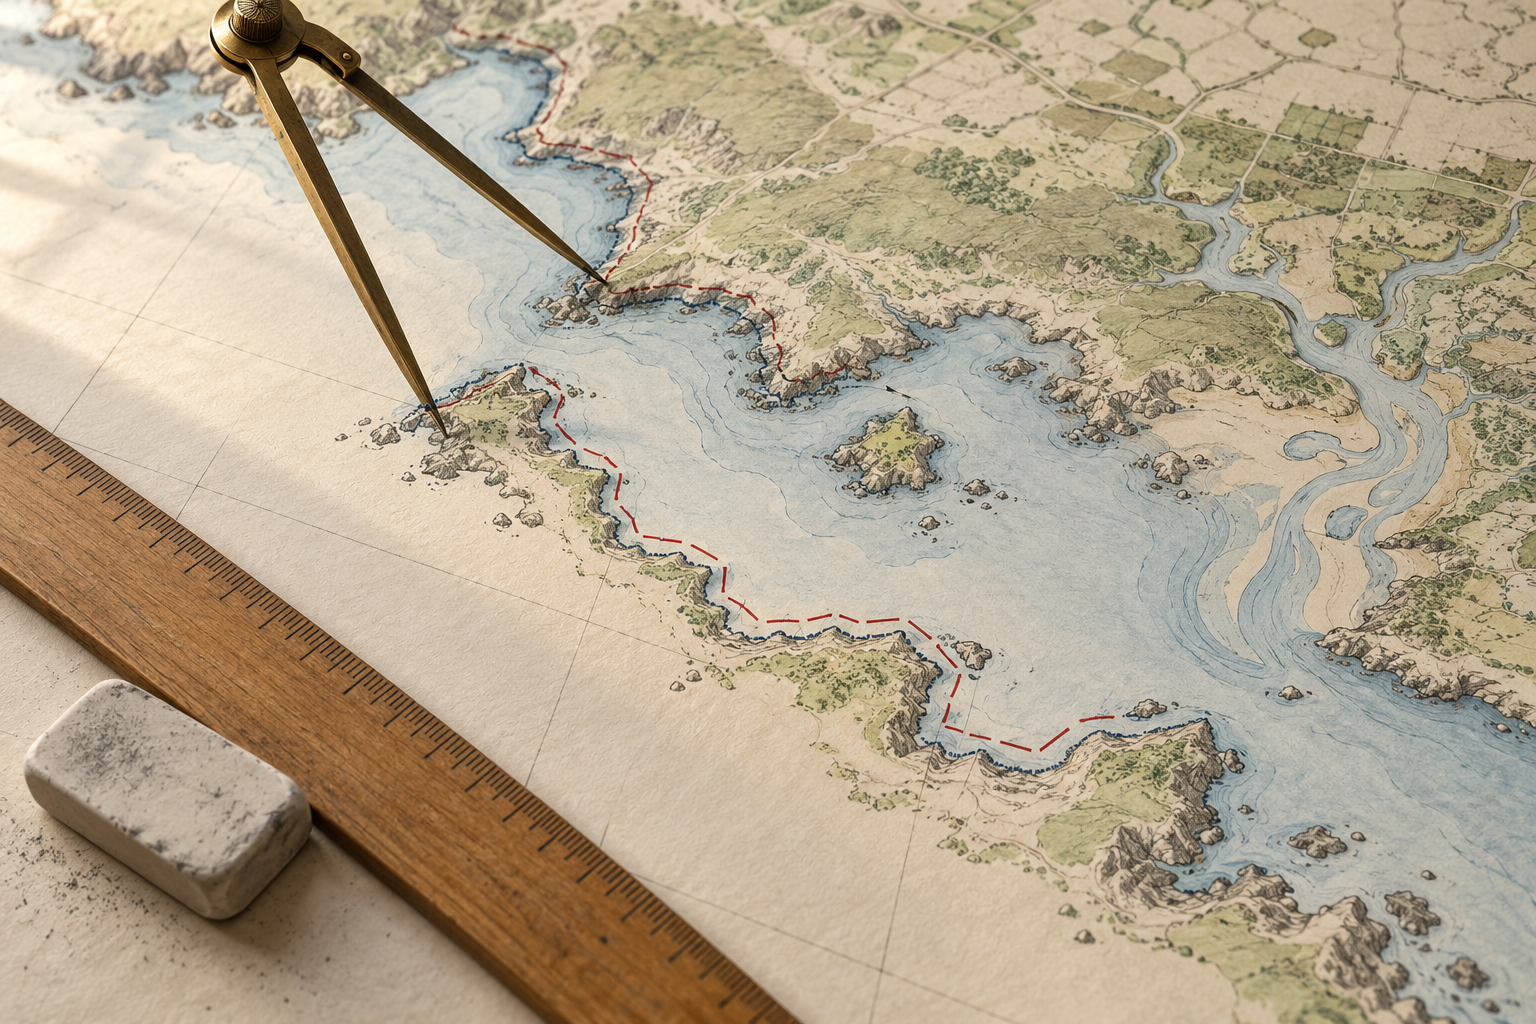
Put a pair of dividers on a map of an island. Step around its edge in long strides and a narrow cove becomes a shortcut across its mouth. Take shorter strides and the dividers enter the cove, turn around a headland, and follow the next recess. The island has stayed where it is. The line you counted has grown.
A coastline length is therefore a measurement with instructions attached. The instructions say which boundary counts as shore, which pieces of water to enter, how finely to follow the line, and which date the map represents. Without them, even a carefully calculated total invites a comparison it may not survive.
The edge has to be chosen
At low tide, a wide beach has one waterline; at high tide, it has another. Neither momentary line is a convenient permanent boundary for a chart. The National Oceanic and Atmospheric Administration's coastal glossary defines its charted tidal shoreline as an interpreted mean high water line: the intersection of land with a selected water elevation. In sheltered waters where tide has little influence, another mean water level may be used. NOAA's 2018 hydrographic specifications likewise describe the nautical-chart shoreline as approximately where mean high water meets the coast.
That line is a convention for making a useful, repeatable map. It is not the same as the wet edge visible at a particular hour. It can also be hard to draw: in a marsh, vegetation may hide the land-water contact. NOAA's glossary calls the seaward vegetation limit an apparent shoreline in such places. A measurement through a marsh thus contains a decision about what could be observed and represented, not just a ruler reading.
This choice matters when people compare maps from different years. In field work on a high-energy Pacific Northwest coast, researchers distinguished a high-water mark visible on older maps or photographs from a shoreline extracted at a mean-high-water elevation. Waves could leave the visible mark higher on the beach. Treating those two traces as identical would mix a change in method with a change in the coast. Their study concerns shoreline position, rather than a national length, but it exposes the same prerequisite: choose the line before measuring it.
Smaller steps discover more bends
The long-stride experiment has a history. In his 1967 paper on the coast of Britain, Benoît Mandelbrot reexamined Lewis Fry Richardson's measurements of irregular boundaries using line segments of different lengths. As the segments shortened, measured length increased. Mandelbrot used statistical self-similarity to describe how some geographical lines retain complexity across a range of scales. His paper made the question famous, but it did not supply one magic ruler with which to discover every coast's final length.
The effect can be measured without invoking an infinity. In a 2015 study of China's mainland coastline, researchers reported about 18,214 kilometres with a 0.25-kilometre measuring step and about 21,900 kilometres with a 0.1-kilometre step, using their selected map and method. The smaller step gathered more indentations. The study also found different irregularity in different coastal regions. Those figures are a controlled comparison within one analysis, not rival claims that China's land changed size between measurements.
An ideal fractal can keep offering new detail as a mathematical ruler shrinks without limit. A real shoreline is a physical, changing place, and any map has finite resolution. Its bends do not obey one scaling rule at every size, down to grains of sand. The practical lesson is simpler: say how detailed the source line is, and how it was simplified. A computer can report a length to many decimal places while still following a line drawn for a small-scale chart.
Mapmakers have to simplify that line. A 1988 NOAA report on cartographic generalization describes removing points and selecting features as charts are reduced in scale, while preserving the geometry important to navigation. A cove too small to draw clearly on one chart may appear on another. The omission is a deliberate property of the map, not a denial that the cove exists.
What belongs in the sum?
There is another choice before anyone traces the first bend. Is a coastline only the ocean-facing edge of a mainland? Do the backs of bays count? The rims of islands? Tidal rivers? Great Lakes? A NOAA shoreline-mileage sheet gives 95,439 statute miles for the United States under its listed compilation. Its note says the tally includes offshore islands, sounds, bays, rivers, and creeks up to the head of tidewater or until tidal waters narrow to 100 feet. It also includes Great Lakes mileage measured separately. Call that number “the U.S. coastline” without the note, and a reader may imagine a very different path around the country's seaward outline.
Geographic databases preserve these distinctions explicitly. NOAA's description of the Global Self-consistent, Hierarchical, High-resolution Geography Database separates the boundary between land and ocean from lake shores, islands in lakes, and ponds in those islands; it also supplies several map resolutions. Those levels are useful because the question “how much shore?” may mean the length of ocean exposure, the length of waterfront to manage, or the perimeter of every mapped water body. A single unlabeled total cannot serve all three.
Modern data do not remove the need for judgment. NOAA's Continually Updated Shoreline Product record describes a vector line assembled from surveys, lidar, extracted features, and other sources, then checked against imagery. Its own completeness note says the available sources may not cover every shore. More precise tools can map more detail, but the resulting length still depends on what was collected, merged, and included.
The coast also moves. Waves, sediment, storms, construction, and changes in water level can alter where a selected shoreline lies. A new map may disagree with an old one because the shore changed, because the chosen boundary changed, or because the newer survey sees bends the older chart smoothed away. Each explanation calls for different evidence.
A useful coastline figure carries its measuring rule close by: the area covered; whether islands, bays and tidal waterways are included; the chosen water-level boundary; the survey date; and the scale or resolution of the traced line. Then a length becomes something more valuable than a large, impressive number. It becomes a description another person can understand, compare, or measure again.
A thought worth keeping?