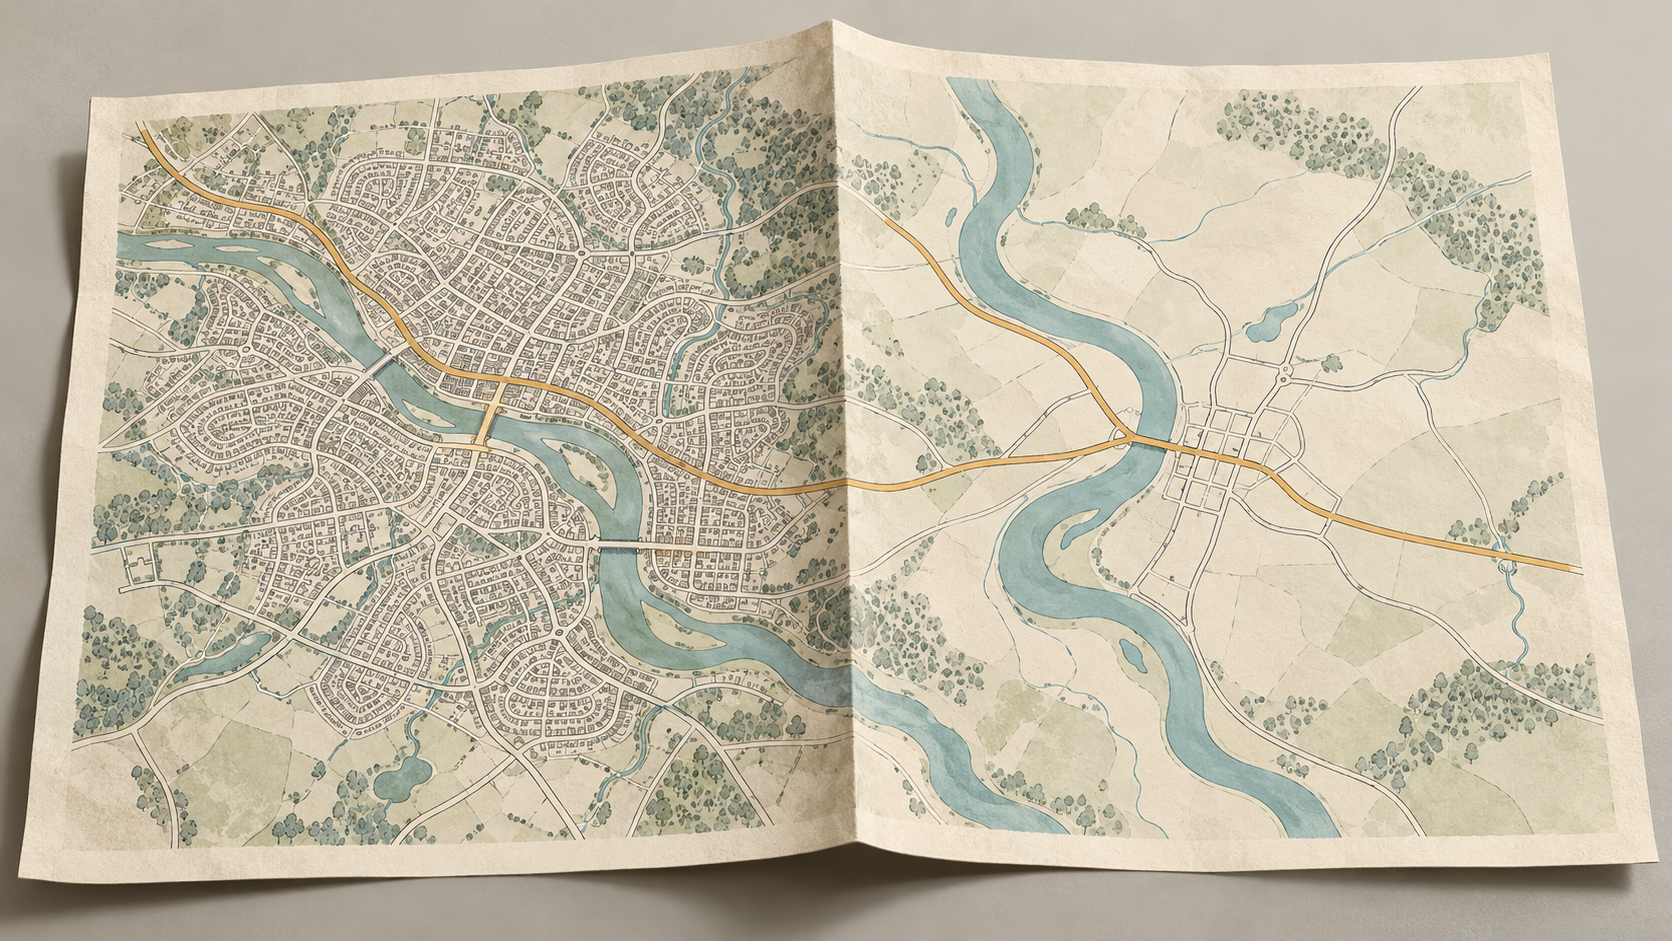
On a street map, the lanes behind a railway station may each have a name and a line. On a map of the whole region, the station may survive as a dot and the lanes may vanish. No asphalt has been removed. The cartographer has changed the question the picture can answer.
There is a physical limit to how many roads a map can hold. At 1:100,000, one millimetre on paper stands for 100 metres on the ground. A road symbol still needs enough width to be seen; a name needs considerably more space. In a town, several streets and their labels can compete for the same few millimetres. The US Geological Survey calls the work of reducing detail and choosing symbols for a particular scale generalization. Its aim is a legible account of the landscape at that scale, with enough of its shape and position preserved to remain useful. The appropriate features also depend on what the map is for. USGS generalization guidance
The first choice, then, is purpose. A regional driving map must make through routes and crossings easy to follow. A walking map may spend the same scarce space on footpaths, stairs and entrances. A map of road maintenance may need every service lane in a district. Calling one road “important” without naming the journey or task hides the editorial decision. Even a general-purpose map has competing aims. The maintainers of the OpenStreetMap Carto style describe legibility, usefulness to the people editing the data, geographic diversity and a rich picture as goals to balance. They explicitly do not aim to display all, or even most, of the underlying data. OpenStreetMap Carto design goals
A network must still lead somewhere
Once the mapmaker has decided what the reader needs, road class provides a starting order. A motorway may carry a long route across the sheet; a short cul-de-sac may help only with a local address. Yet a simple rule such as “keep every major road and drop every minor one” can leave a broken journey. The modest connector from a main road to a bridge, ferry landing or station may be the link that makes the visible network intelligible. A line that seems slight by itself can matter because of the lines it joins.
This is why road selection is a problem of relationships. Esri’s Thin Road Network tool considers hierarchy, density and the significance of roads within longer itineraries. It can mark a road segment as invisible at a chosen scale while leaving its geometry in the input data; roads fixed to remain visible can bring adjacent connecting segments with them. The tool also depends on properly connected intersections in the source data. If two lines merely cross in a drawing when the roads do not meet, or fail to meet where they should, the selection can inherit the mistake. Esri, Thin Road Network
Researchers have tried to capture the patterns that a person recognizes at a glance. Guillaume Touya’s road-selection study begins by detecting structures such as roundabouts and interchanges, then treats rural routes and urban blocks differently while preserving continuity between them. In a separate study, Wei Wu and Zhaoting Ma used road length, connectivity and the density of the urban mesh in an automatic selection method tested on a 1:10,000 road map in Jiangsu. These are particular methods, not a recipe that makes every possible map. Together they show why counting roads or sorting them by an administrative class cannot by itself preserve a recognizable street network. Touya’s original study · Wu and Ma’s original study
Selection has a second, quieter obligation: retain the character of the place. A sparse rural district and a tight city grid cannot be thinned by identical numbers without making one of them strange. Too many city streets turn the page into a gray patch; too few erase the grid that helps a reader understand where the centre lies. The USGS puts this in terms of representing features at a scale while keeping their characteristic shapes and positions. The desired amount of detail changes with the size of the area shown. USGS generalization guidance
When lines are too close to tell apart
Choosing the roads is only part of the job. Their ink has a width. A pair of parallel carriageways can be distinct in a geographic database and merge into one dark stroke on a small map. A roundabout can be drawn with its surveyed dimensions yet look like a filled dot. A dead-end lane can stop short of a main road in the data and appear to touch it once both lines acquire thick symbols. These are graphic errors: the map suggests a connection or a shape the underlying network does not have.
Cartographers sometimes adjust the drawing to keep the relationship honest. Esri’s Resolve Road Conflicts tool examines symbolized roads at a specified output scale and can shift nearby lines apart. Its documentation describes shortening the visible end of a cul-de-sac to preserve a gap from another road, and enlarging a small roundabout enough to show its centre. Those are deliberate changes in depicted geometry, governed by line width, hierarchy and spacing. A reader tracing a route benefits from the distinction between “joins” and “passes near”; someone measuring the exact position of a kerb should use data and methods suited to that measurement. Esri, Resolve Road Conflicts
Other adjustments remove bends too small to read, combine divided roads into a single line or choose a simpler outline for a complex junction. Esri’s guide to multiscale map authoring describes generalization as deciding what to keep, eliminate, exaggerate and simplify, while also adjusting which layers and symbols draw at different scales. It warns that displaying source data much larger than the scale at which it was captured implies precision the source may not contain. A crisp line on a screen is not a certificate of survey accuracy. Esri, Author a multiscale map
A road can wait for the next zoom
The same space problem follows a map onto a phone. A digital map can change its contents as the reader zooms, but at any one zoom level the screen still has a finite number of pixels. The mapmaker can decide that local streets should appear only when there is room for them. This is a display choice; it need not remove those streets from the geographic database. As the screen moves inward, more detail is drawn from available data and the picture changes its emphasis. The transition has to be designed too, so a route does not flicker awkwardly between versions. Esri, Author a multiscale map
There is a documented example of why a style might hold roads back. In 2015, the OpenStreetMap Carto project recorded a decision to render minor roads later at middle zoom levels. Its maintainers said that as residential, unclassified and service roads were mapped across a city, the view had become overcrowded and hard to read. That note is useful because it names both sides of the choice: more complete underlying data made the image less useful at that scale, and the remedy changed when those lines appeared, rather than treating the streets as unworthy of a map. OpenStreetMap Carto changelog, v2.32.0
There is also a limit to what a missing line can tell you. It may have been left out for clarity, hidden by a style rule, absent from the source data or changed since the data was collected. The drawing alone cannot decide which explanation applies. A more detailed map, its scale and legend, and information about its source can help when the distinction matters. A road map is strongest when read for the relationships it was designed to show: which places connect, where a crossing lies, and how a route runs through the area. The lines earn their place by making that structure visible.
A thought worth keeping?